UVA ROS Protection Assay: Sculpting Cream
UVA ROS Protection Assay: Sculpting Cream
1.0 OBJECTIVE:
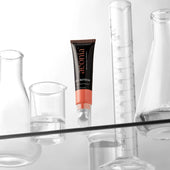
The purpose of this study was to evaluate the ability of the Aeonia Sculpting Cream to protect against UVA induced ROS formation.
2.0 PROCEDURE
2.1 Tissue Preparation
Upon arrival, the MatTek EpiDerm Tissues were stored at 4°C until used. Prior to use, the tissues to be used were removed from the agarose-shipping tray and placed into a 6-well plate containing 0.9 ml of hydrocortisone free assay medium (37±2°C). The tissues were allowed to incubate for one hour at 37±2°C and 5±1% CO2. After this incubation period, 100 μl of 5 μM CM-H2DCFDA (ROS sensitive dye) prepared in PBS was applied topically to the tissues and the tissues were incubated for an additional one hour. At the end of the incubation period the tissues were rinsed three times with 300 μl of PBS and transferred to a 24 well plate containing 300 μl of PBS.
2.2 Application of test material
Prior to exposing the cells to UVA light, 6 μl of test material was applied topically to the tissues and spread evenly across the tissue using a cell scraper. Non-UVA exposed tissues and untreated tissues were topically treated with PBS, while the positive control tissues were treated with PBS supplemented with 150 μg/ml Trolox. After the application of the test material a baseline fluorescence measurement was made of the surface of the tissues using an excitation wavelength of 485 nm and an emission wavelength of 518 nm.
2.3 UVA Light Exposure
The EpiDerm tissues were exposed to UVA light at room temperature using a XX-20BLB UV Bench Lamp emitting 365 nm light at an intensity of 2 mW/cm2. Non-UVA exposed tissues were also kept at room temperature protected from light. Changes in fluorescence were measured at 15, 30 and 45 minutes (UVA doses of 1.8, 3.6 and 5.4 J/cm2, respectively).
2.4 ROS Formation
Nine fluorescent measurements were made across the surface of the tissue for each measurement and the average of these nine measurements was used as the indicator of ROS formation for each tissue. The baseline fluorescence for each tissue was then subtracted from the 15 and 30-minute values to calculate the change in ROS formation with UVA exposure. Mean fluorescence values (RFU) were then determined for each treatment at each time point. Treatments within each time point were then compared using an ANOVA.
3.0 RESULTS
The results for the ROS assay are presented in Table and Graph 1. All values are expressed in relative fluorescence units (RFUs). Values are expressed as means ± standard deviation (n=3 per treatment). An (*) denotes values that are significantly different from the Untreated tissues (p<0.05).
Table 1. UVA ROS Formation


4.0 RESULTS
In this study, exposure of the MatTek EpiDerm tissues to UVA light resulted in a significant increase in the formation of ROS. This increase in ROS formation was prevented in tissues treated with the Aeonia Sculpting Cream.
Disclaimer: This document is a summary of a Aeonia Sculpting Cream study performed by an independent third-party testing facility. We believe the information provided here is correct but past performance is not necessarily indicative of future results.


